Analytics - User Guide
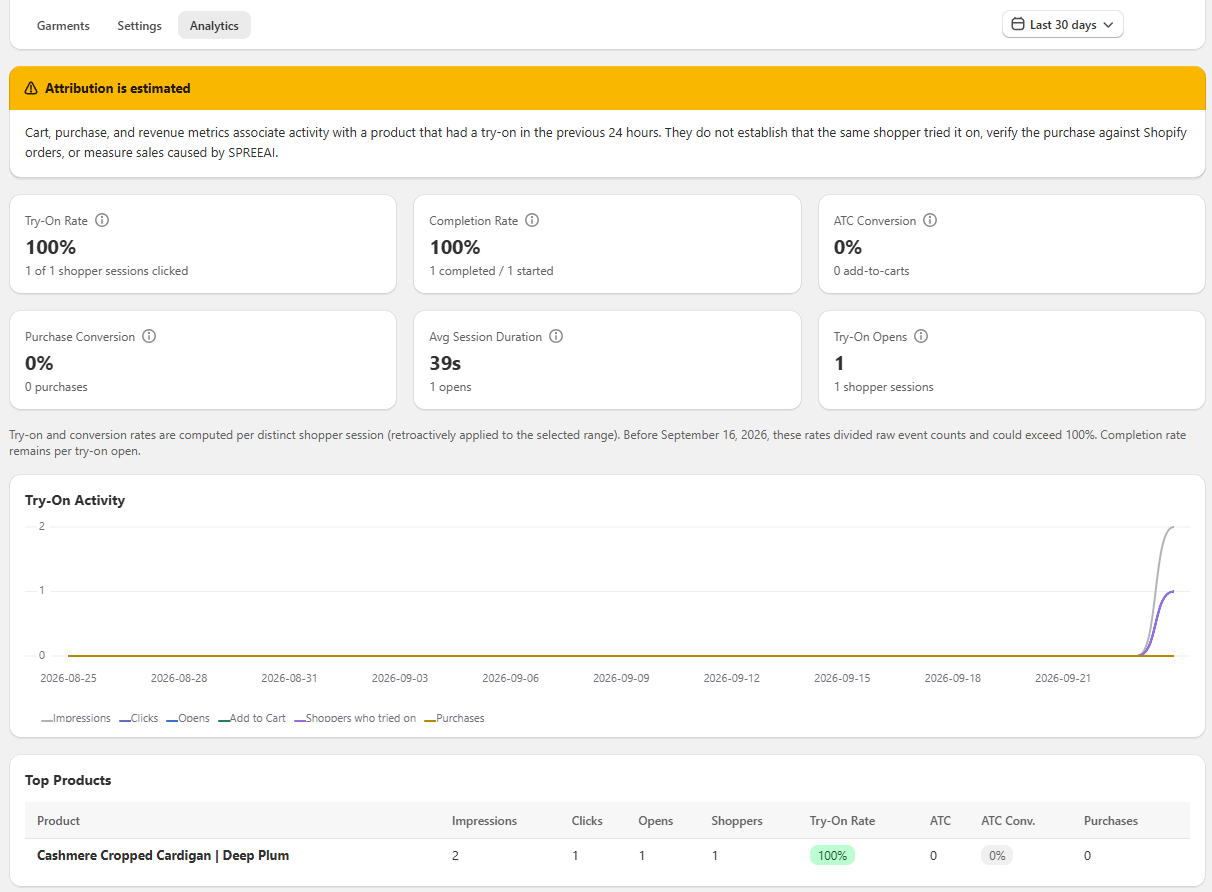
The Analytics tab shows how shoppers use the Try-On button in your store. It tells you how many shoppers see the button and open the try-on. It also tells you how many shoppers add the product to the cart or buy it.
To open the tab, open the SPREEAI app in your Shopify admin. Then click the Analytics tab.
Definitions
| Word | Meaning |
|---|---|
| Impression | The Try-On button appeared on a product page. |
| Click | A shopper clicked the Try-On button. |
| Open | The try-on experience opened for a shopper. |
| Shopper session | One browser tab of one shopper. Two tabs count as two sessions. |
| ATC | Add to cart. |
The app does not collect names, emails, or cookies. A shopper session is an anonymous number that the browser keeps only while the tab is open.
Before you start
The tab is empty until shoppers use the Try-On button on your storefront. If you see "No analytics data yet", go to the Garments tab. Make sure that at least one garment is Live. A Ready garment is prepared but still hidden: switch its Try-On Status to Enabled, or select it and click Enable Try-On, and its status changes to Live (see Step 7 of the Onboarding Guide). Then open that product page in your store and try it on yourself. Your visit appears on the analytics tab.
Filtering data
A date range button is at the top right of the page. At your first visit, it shows "Last 30 days".
- Click the date range button.
- To use a preset, click Last 7 days, Last 10 days, Last 20 days, Last 30 days, or Last 90 days.
- To use your own dates, click the first day in the calendar, then click the last day.
- Click Apply.
All the numbers, the chart, and the table change to the range that you select. The note under the calendar tells you the time zone that the app uses to count days. This is usually the time zone of your store.
How attributed sales are measured
When a product is added to the cart or purchased, the app checks whether any shopper opened a try-on for that same product in your store during the previous 24 hours. If so, the add to cart or the purchase is attributed to the try-on.
Keep in mind:
- Product-based, not shopper-based. The match is on the product only. The app does not check that the same shopper, browser, or session tried on the product and then bought it.
- Not reconciled with Shopify orders. These figures are tracked on their own and aren't matched against your store's order records.
- Correlation, not causation. These figures show purchases that came after a try-on. They don't show how many sales SPREEAI directly caused.
Use these metrics to spot trends and gauge engagement, not as exact revenue figures.
How to read metrics
Each card shows a main number and a short line of detail under it. To see the definition and the formula of a card, move your pointer over the (i) icon next to its name.
| Card | What it tells you | How the app calculates it |
|---|---|---|
| Try-On Rate | The share of shoppers who clicked the button after they saw it. | Sessions with a click, divided by sessions with an impression. |
| Completion Rate | The share of try-ons that shoppers finished and closed, and did not abandon. | Try-ons closed, divided by try-ons opened. |
| ATC Conversion | Add to carts after a try-on, for each shopper who opened the try-on. | Add-to-cart events, divided by sessions that opened the try-on. |
| Purchase Conversion | Purchased items after a try-on, for each shopper who opened the try-on. | Purchased line items, divided by sessions that opened the try-on. |
| Avg Session Duration | The average time that shoppers stay in the try-on, from open to close. | The average of all try-on durations. |
| Try-On Opens | The number of times that the try-on opened. | All opens. The detail line gives the number of shopper sessions. |
A shopper who clicks five times in the same tab counts as one in the Try-On Rate. A dash in place of a value means that there is no data to divide by in the range. ATC Conversion and Purchase Conversion can go above 100%, because one shopper can add or buy more than one item.
To get the average opens per shopper, divide Try-On Opens by the shopper sessions under it. A high value tells you that shoppers compare sizes or colors before they decide.
The grey note under the cards is about a change on September 16, 2026. From that date, the app calculates the Try-On Rate, ATC Conversion, and Purchase Conversion per shopper session, and it applies this rule to all past dates. Before that date, these rates used raw event counts, and some of them went above 100%. The Completion Rate did not change: it is still calculated per try-on open.
How to read the activity chart
The chart shows one point for each day of the range. It has six lines: Impressions, Clicks, Opens, Add to Cart, Shoppers who tried on, and Purchases. Move your pointer over the chart to see the exact values for a day.
Use the chart to find changes over time. For example, compare the days before and after a campaign or a new product launch. If Impressions go up but Clicks stay flat, the button is visible but shoppers do not use it.
How to read the top products table
The table shows the 10 products with the most shoppers who tried them on. If two products have the same number of shoppers, the product with more opens comes first.
| Column | Meaning |
|---|---|
| Product | The name of the product in Shopify. |
| Impressions | The number of times that the button appeared on this product page. |
| Clicks | The number of clicks on the button. |
| Opens | The number of times that the try-on opened. |
| Shoppers | The number of shopper sessions that opened the try-on. |
| Try-On Rate | The share of sessions that clicked after they saw the button. The badge is green above 10%. |
| ATC | The number of add to carts after a try-on. |
| ATC Conv. | Add to carts for each shopper who tried on. The badge is green above 5%. |
| Purchases | The number of purchased items after a try-on. |
If a product shows a low Try-On Rate, make sure that its images are clear. Also make sure that the button is easy to see. If a product has many shoppers but few add to carts, look at its price, sizes, and stock.
Tips
- Use a range of 30 days or more for decisions. Short ranges with few shoppers can give large changes in the rates.
- Compare products with the same range.
- Numbers of 1,000 or more show in a short form, for example 1.2K.